
July 8, 2026
A forensic ratio analysis that identifies six converging earnings-manipulation red flags in a SaaS company case study, paired with a proposed five-stage automated fraud detection architecture.
Maxwell Tech Solutions Ltd., the SaaS company case study, showed three years of steady reported revenue growth alongside whistleblower-style concerns about the quality of that reporting. The goal here was to apply forensic ratio analysis and see whether the underlying financial trends actually supported the reported growth story or contradicted it, then propose a systematic, automated framework for catching this kind of pattern earlier in a real organization.
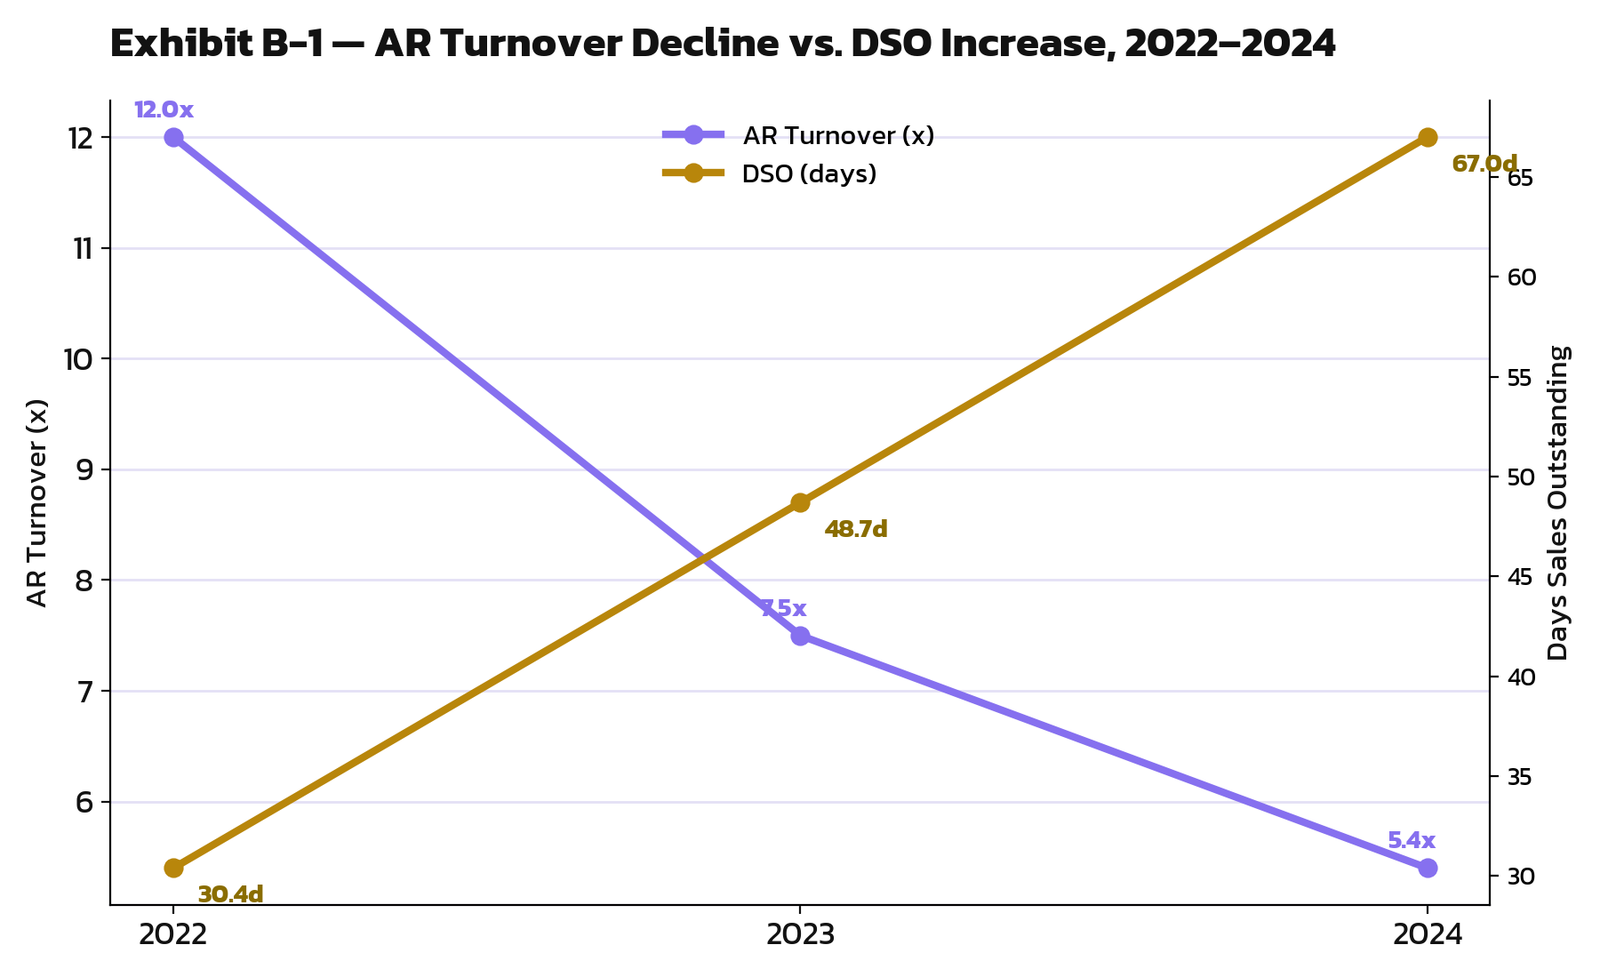
Accounts Receivable Turnover fell from 12.0x to 5.4x over three years while Days Sales Outstanding more than doubled. Collections were slowing sharply even as reported revenue grew, which is a classic sign of aggressive or premature revenue recognition.
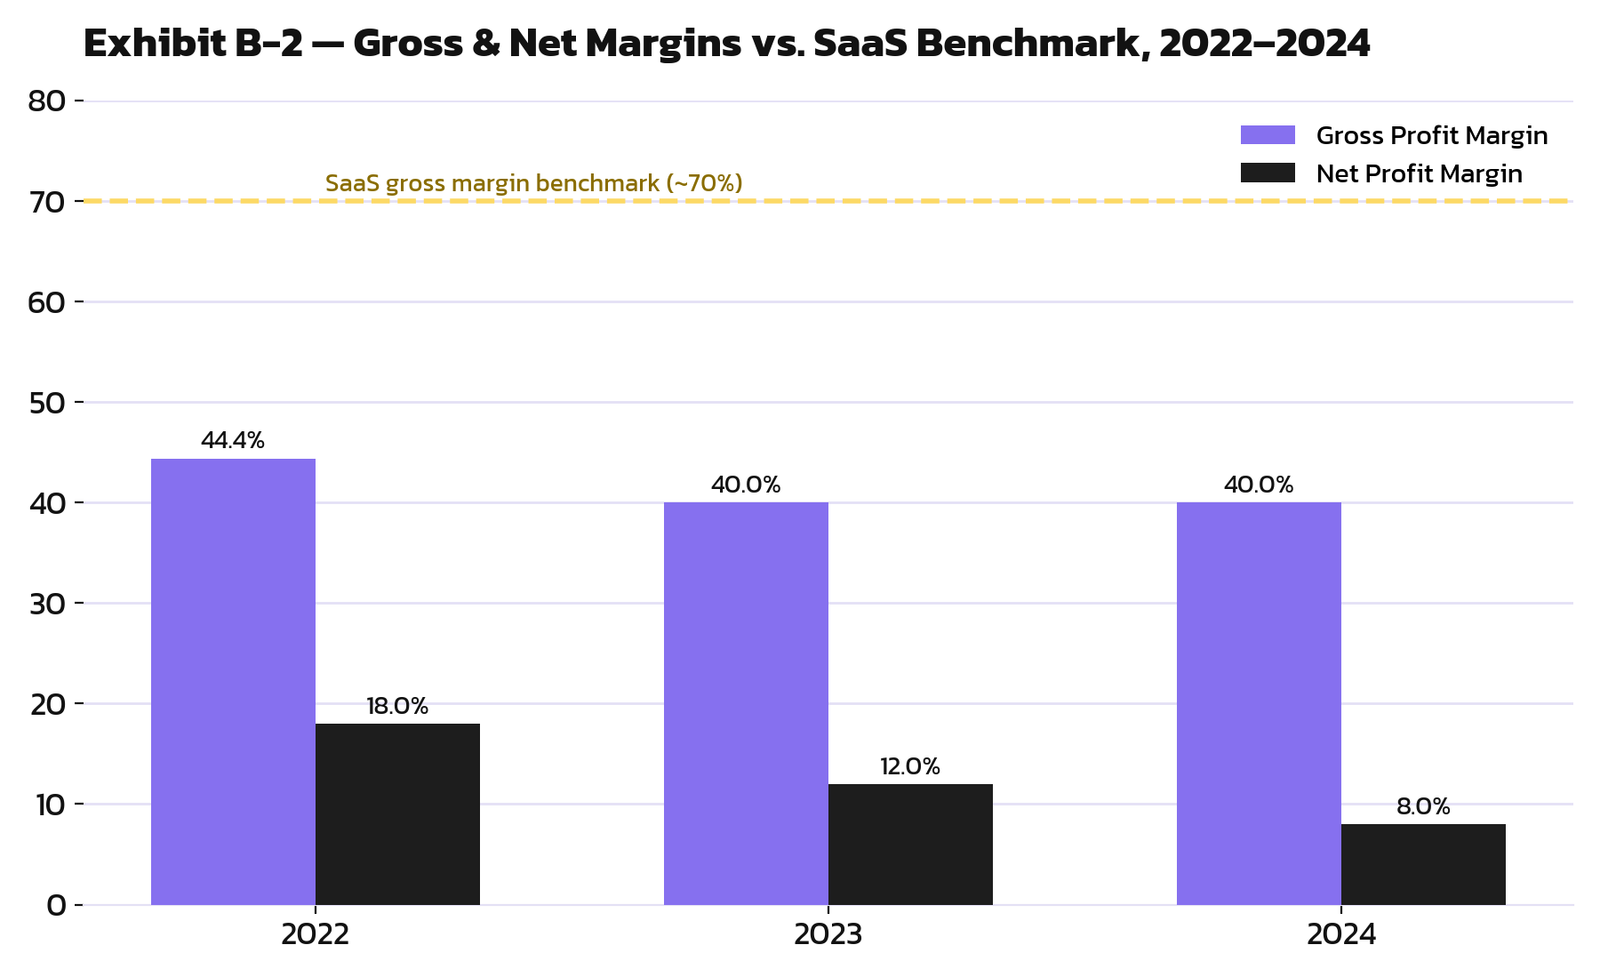
Gross margin sat at 40 to 44% throughout the period, far below the 70 to 85% typical of mature SaaS businesses, while net margin drifted down even as revenue nearly tripled. That’s not consistent with the operating leverage a scaling SaaS company should show.
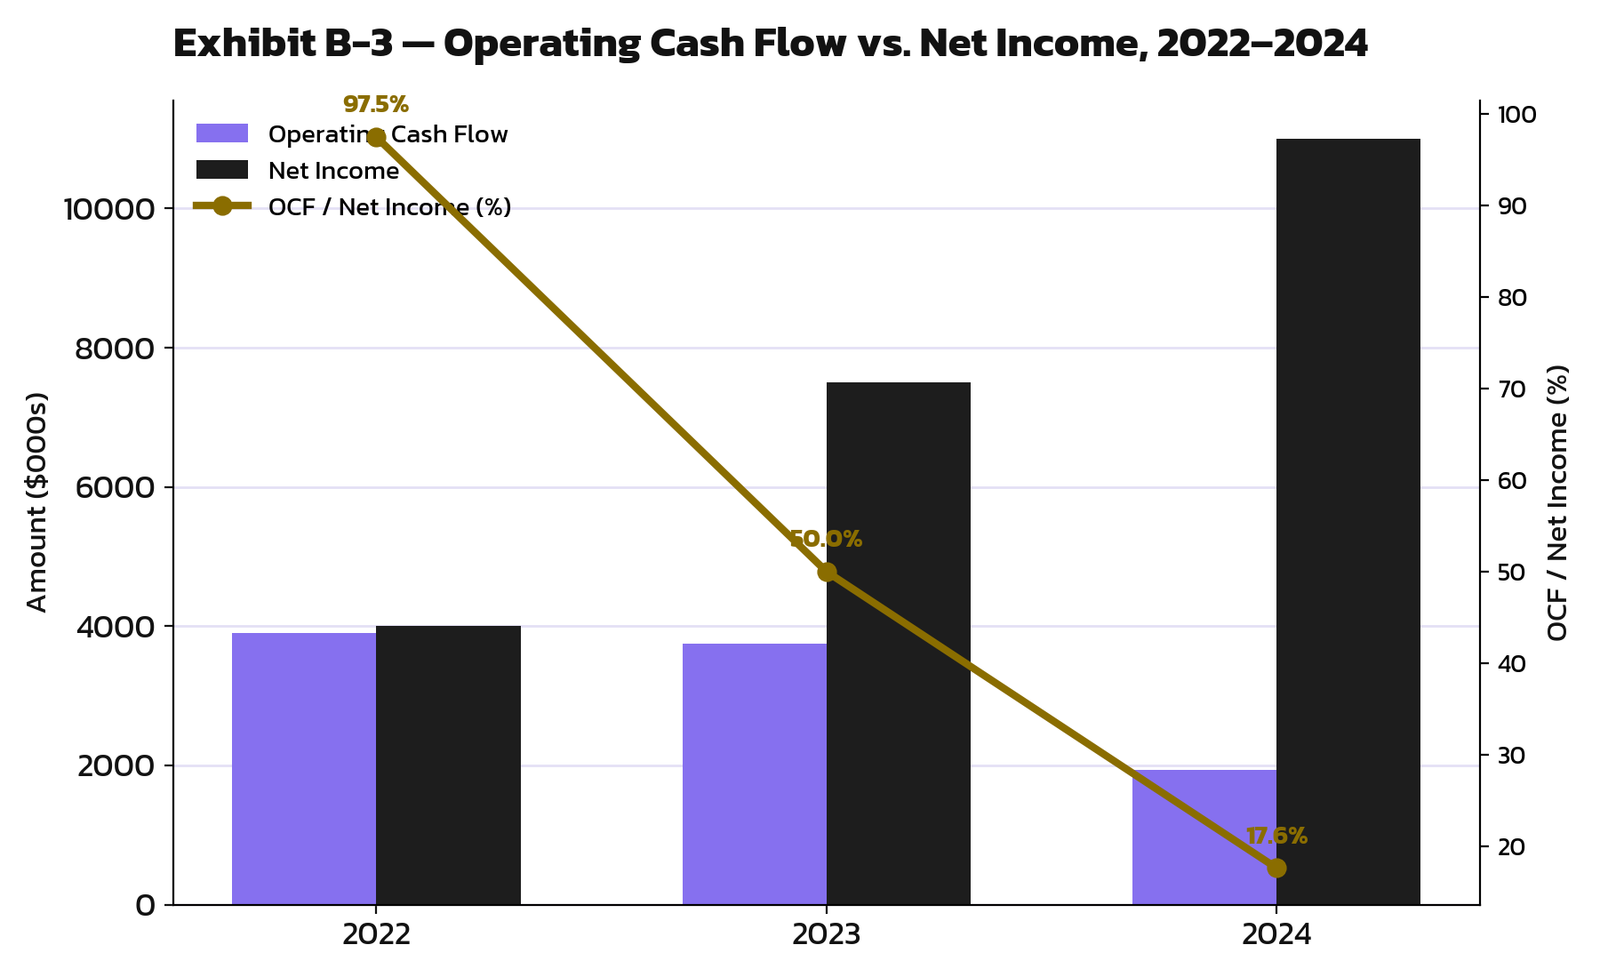
The most serious signal is that Operating Cash Flow fell even as Net Income rose. The OCF-to-Net-Income ratio collapsed from 97.5% to 17.6% over three years, meaning earnings were increasingly disconnected from actual cash collection. Of everything in this dataset, this is the strongest single indicator of potential earnings manipulation.
The original analysis referenced the Beneish M-Score model conceptually but never actually calculated it. Five of the model’s eight standard variables can be computed directly from the available data. The remaining three (AQI, DEPI, SGAI) require PP&E, depreciation, and SG&A detail that isn’t present in this dataset, so instead of a single blended M-Score, only the components that can be honestly calculated are shown below.
Above 1.0 both years, receivables growing faster than sales.
Near/below 1.0, margin did not deteriorate, a mixed signal.
Elevated growth, consistent with revenue-recognition risk.
Rising positive accruals, an earnings-quality red flag.
Rising, leverage increasing faster than the prior year.
5 of 8 standard M-Score variables are computable from the data provided. AQI, DEPI, and SGAI require PP&E, depreciation, and SG&A detail not available in this dataset, so no single blended M-Score is presented.
Four of the five computable components point the same direction: rising receivables relative to sales (DSRI), elevated revenue growth (SGI), rising positive accruals (TATA), and rising leverage (LVGI) are all consistent with the qualitative red flags identified above. That gives the finding a second, independent layer of quantitative support.
Beyond identifying the red flags after the fact, this project proposes a five-stage system for catching this kind of pattern earlier and continuously, rather than only during year-end review.
Data flows from ERP, general ledger, and external filings (XBRL/MD&A) into COSO-aligned control checks, then through automated ratio-based red-flag detection, predictive modeling (Logistic Regression and Random Forest scoring), and finally into forensic alerting. Confirmed findings then feed back into threshold tuning for the next detection cycle.